> ## Documentation Index
> Fetch the complete documentation index at: https://docs.kameleoon.com/llms.txt
> Use this file to discover all available pages before exploring further.
# Statistical significance
> Understand how Kameleoon calculates statistical significance and reliability scores, and learn how to interpret and improve your experiment results.
## What is statistical significance?
### Hypothesis testing
When you launch an experiment in Kameleoon, you want to know whether the variation you're testing actually improves a given metric compared to your original site. In statistical terms, you make a hypothesis and then try to refute it by observing data.
To help you decide, Kameleoon uses the frequentist statistical framework, which assesses how likely the observed data is if the "null" hypothesis is true. Kameleoon computes this probability as the "p-value."
### Statistical significance and reliability
An experiment is statistically significant if the sample data Kameleoon collects is sufficiently inconsistent with the data Kameleoon would expect under the null hypothesis.
To help you assess whether an experiment result is statistically significant, Kameleoon calculates the experiment's reliability as:
**"reliability" = 1 - "p-value"**
### Example
Consider the following example:
* Reference variation: 142,000 unique visitors tested, 3.52% conversion rate (5,000 sales)
* Variation 1: 216,000 unique visitors tested, 3.64% conversion rate (1,850 sales)
This example tests whether variation 1 performs better than the reference variation. The null hypothesis states that the reference performs as well as or better than the variation, and the test aims to reject it. Set a significance level of 0.05 to limit the risk of incorrectly rejecting the null hypothesis to 5% of the time.
Variation 1 outperforms the reference variation, and the reliability reaches 96%. Because 96% exceeds the 95% reliability that a 0.05 significance level requires, the result is statistically significant.
## Checking statistical significance
Whether you use Google Analytics or Kameleoon as your reporting tool, Kameleoon automatically calculates your experiment's statistical significance so you can check whether a variation performs better or worse than the reference.
### Reliability
Check your campaign's reliability on the Results page in several ways.
#### Primary goal
The **Primary goal** section of the **Overview** menu lists your variation's reliability rate for the primary goal.

In this example, the reliability rate for both variations exceeds 99%.
#### Charts
The **Charts** section of the **Overview** menu shows a visual representation of reliability rate over time.

Use the dropdown menu to select which variations to display; Kameleoon selects all variations by default. You can also choose to view data by **Day**, **Week**, or **Month**. Hover over the chart to view more reliability rate data.
#### Metrics
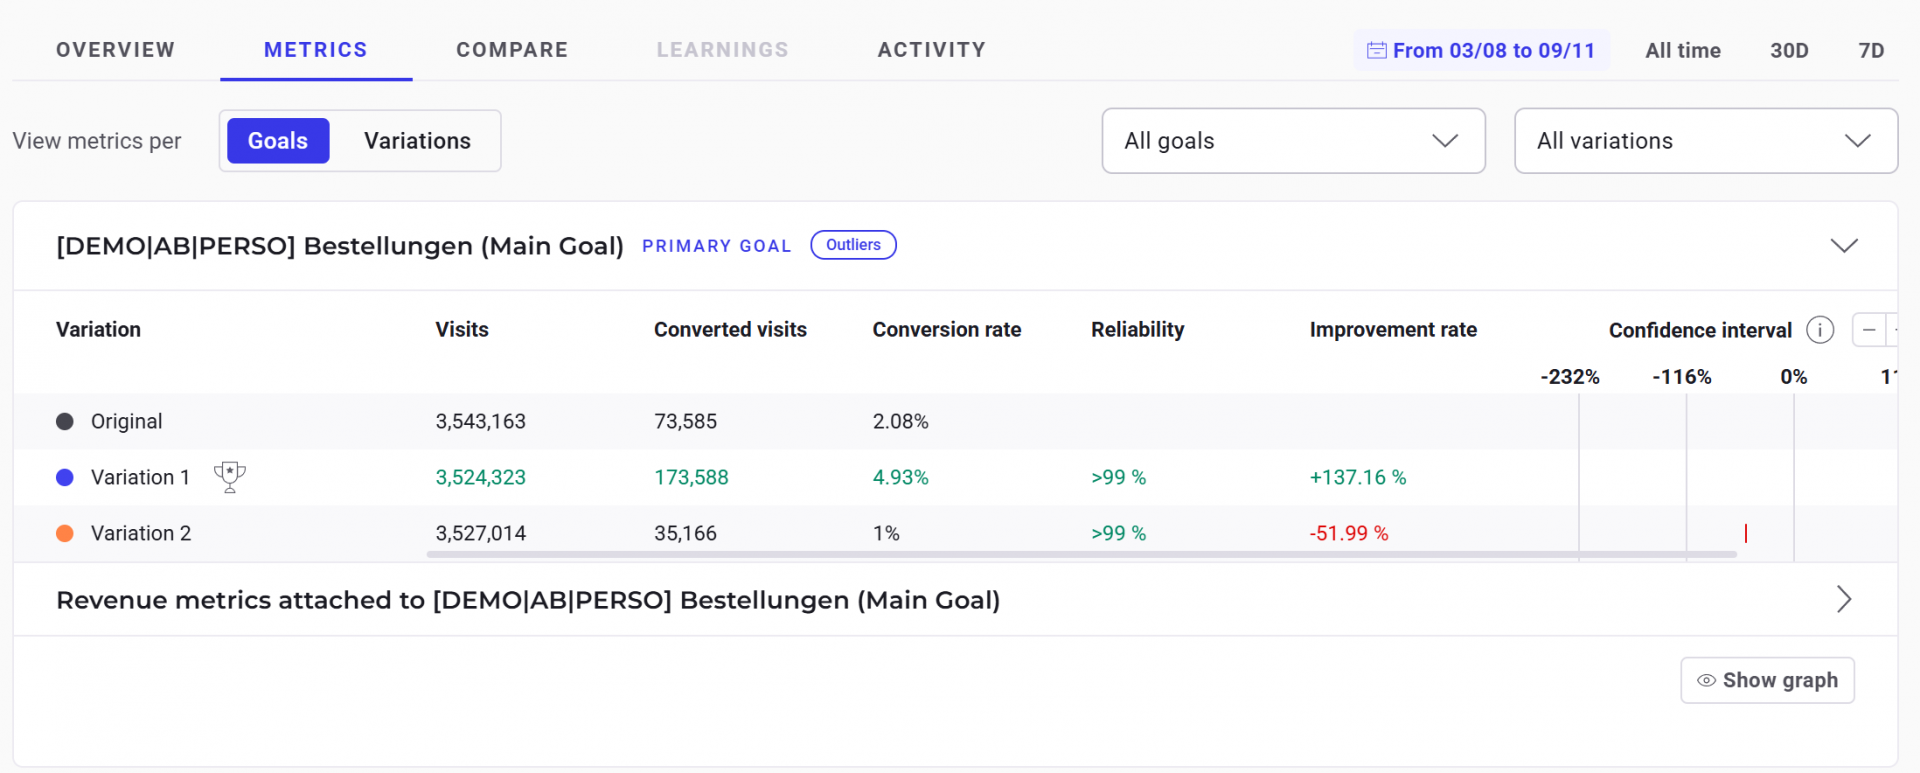
The **Metrics** menu displays reliability rates. Click **Goals** or **Variations** to view reliability rate by goal or variation.
## What to do if you don't reach sufficient reliability
If your reliability rate is stable but insufficient, consider these common causes:
* The page doesn't receive enough traffic.
* The difference between the original's performance and the variation's performance is too small to draw conclusions. For example, the change you made might have very little impact on visitor behavior.
However, you can draw conclusions from a reliability rate that stabilizes at 75%. If the page doesn't receive enough traffic, the reliability rate probably won't reach 95%. Even so, the Kameleoon Results page still offers a wide range of data and indicators to help you understand your audience.
You can change the minimum reliability rate Kameleoon requires to consider a variation the winner. To do so, click **Admin > Sites** in the Kameleoon App, then open the tab dedicated to Experiments to modify the minimum reliability rate.
