

Global settings
Before analyzing your data, ensure you are viewing the correct timeframe and project scope.Select a timeframe
At the top of the page, use the time selector to define the period for your displayed data. You can choose from the following options:- 7 days
- 14 days
- 30 days
- 3 months
- 6 months
Customize your dashboard
Click Customize in the top right corner to configure your Homepage view. A pop-up window allows you to adjust the following settings:- Data settings:
- Site: Select the specific site or project you want to view data for.
- Goal: Choose the primary goal used to calculate the Key Performance Indicators (KPIs) in the Highlights section. The KPIs displayed will vary depending on whether the selected goal is monetary (for example, revenue) or non-monetary (for example, conversions or retention).
- Display blocks:
- Toggle the eye icon next to any section name to hide or show that block on your homepage.
- Click Apply to save your changes.
Dashboard sections
The Homepage is divided into several sections (blocks) that provide specific insights and shortcuts.Recently opened
Quickly resume your work without searching through the platform. This section lists the pages you visited most recently, including:- Experiments
- Personalizations
- Feature flags
- Widgets
Highlights

The metrics displayed on the Homepage are not real-time. Data is updated daily and reflects activity up to the previous day.
Launched campaigns
Track your historical activity with the Launched campaigns section. This area shows a timeline of the campaigns you have rolled out, helping you visualize the volume of experiments or flags deployed over time.Currently live
View a list of all campaigns that are currently active and impacting users. This section helps you understand exactly what is running on your site right now. The table displays:- Name: The name of the campaign.
- Type: Whether it is an A/B test, personalization, or feature flag.
- Live since: The duration the campaign has been active.
Health Checks
The Health Checks block gives you an at-a-glance view of the experiments that need your attention, without opening each one individually. It surfaces the same health checks you’ll find on an experiment’s Health tab in the Results page, so you can spot data-quality issues across all your live experiments from a single place. The block appears on your homepage alongside your other blocks (such as Currently live and Launched campaigns). It is scoped to the project currently selected on your homepage.
Reading the block
The block has two parts: Status summary — Four counters at the top show the overall picture across all of your live experiments in the selected project:- Passed — all checks are healthy.
- Warning — at least one check needs review.
- Failed — at least one check has failed.
- Pending — checks have not yet run (for example, a newly launched experiment).
Viewing check details
Hover over the status of any experiment to open a tooltip showing the result of each individual health check for that experiment (such as Visit Tracking, Conversion Tracking, SRM, and Overlapping Exposure). For a full explanation of what each check means, see Health checks on the Results page. The tooltip also displays a Last update timestamp for that experiment, so you know how recent the results are. This reflects the last time the checks were evaluated for that specific experiment; if it has not been evaluated individually yet, the most recent daily update is shown instead.Opening the full diagnostics
To investigate an issue, click an experiment row or the See all checks link in the tooltip. This takes you straight to the Health tab of that experiment’s Results page, where you’ll find the full breakdown and recommended next steps.When the block is empty
If none of your live experiments have a warning or failed check, the block shows:No health check alerts All your live experiments are running as expected.
The Health Checks block is available for A/B tests, Feature Flags, and Personalization experiments. It is not available on PBX plans.
Targeted unique visitors
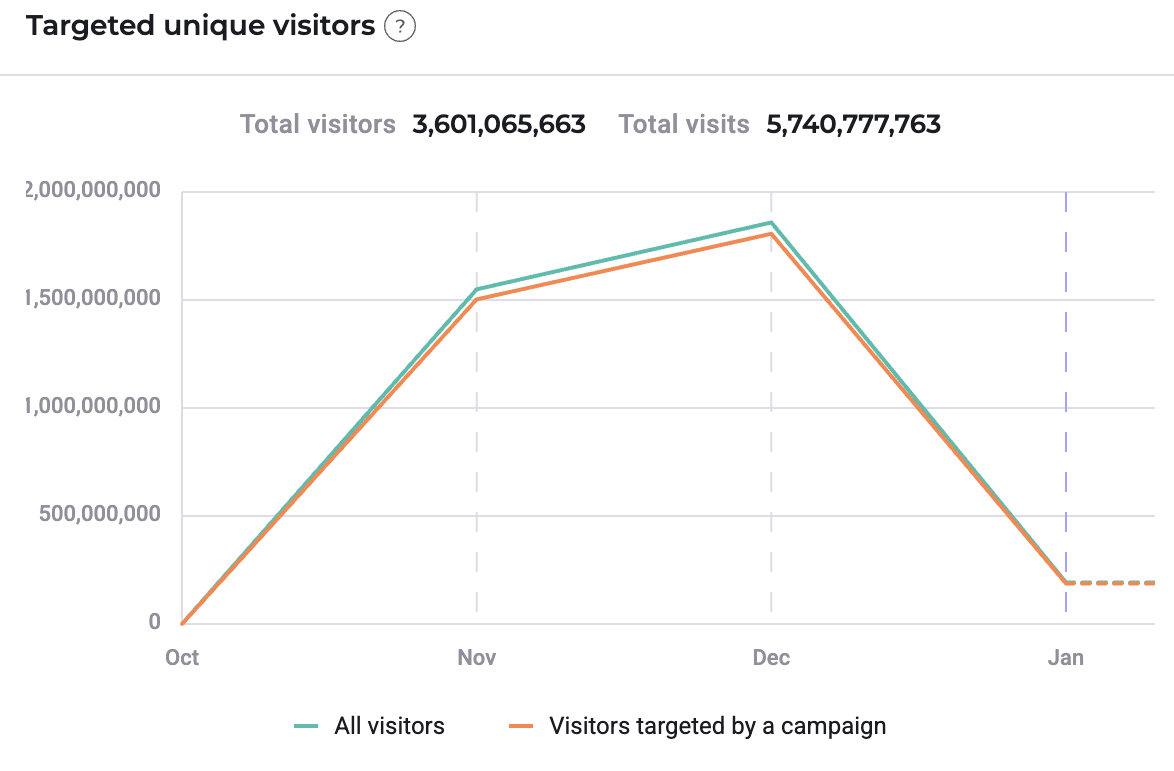
A “unique visitor” is counted only once per session, even if they are exposed to the campaign multiple times.
Scheduled campaigns
Anticipate upcoming work by viewing campaigns planned for a future launch. This section lists experiments and flags that are scheduled but not yet active.Team notes
Use the Team notes section to coordinate with your team, leave reminders, or provide context on ongoing work.- This is a shared free-text area.
- Everyone with access to the project can view and edit these notes.
- Changes are saved automatically and shared across the team.