

The Takeaways page consolidates experiment results and AI-generated insights in one place. Insights are powered by PBX Analyze, Kameleoon’s AI engine that surfaces insights and recommendations for your experiments. Use it to review outcomes across experiments and collaborate with your team without navigating individual results pages.Documentation Index
Fetch the complete documentation index at: https://docs.kameleoon.com/llms.txt
Use this file to discover all available pages before exploring further.
Access Takeaways
Click Insights > Takeaways.
Included experiments
An experiment appears in Takeaways only when it meets the following criteria:- Status: The experiment is Stopped, or Paused for 45 days or more.
- Traffic and conversions: The experiment has at least 100 visits and 20 conversions globally and a defined reference variation.
- Variations: At least two variations have collected data.
Search, sort, and filter experiments
Search
Use the search bar at the top of the page to find experiments by name or keyword.Sort
Click the sort dropdown to order experiments by:- Biggest uplift: Experiments with the highest positive uplift appear first.
- Lowest uplift: Experiments with the lowest uplift appear first.
- Most recent: Most recently modified experiments appear first.
- Least recent: Oldest experiments appear first.
Favorites
Click Favorites to display only the experiments you have marked as favorites.Filters
Click Filters to open the filter sidebar and refine the experiment list by:- Project
- Result (Win, Loss, or Inconclusive)
- Creator
- Goal
- Segment
- Experiment type
- Key date (last modification, last status change, or creation)
Key date filter
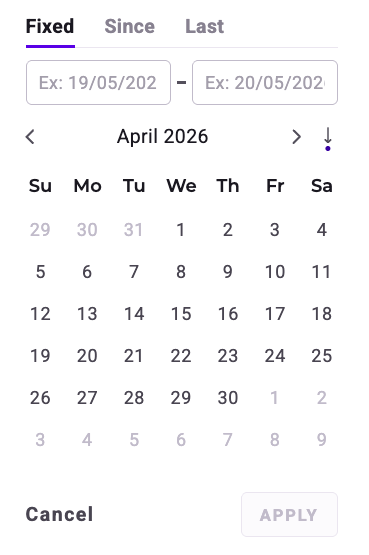
After selecting a key date filter, click Click to choose a date. A calendar view opens where you can configure the date range using one of the following options:- Fixed date range: Specify a start and end date.
- Since date: Show experiments from a specific date to today.
- Last date: Show experiments within a defined period of recent days.
Experiment cards
Each experiment card displays key information at a glance:- Target
- The segment or audience targeted by the experiment.
- Primary goal
- Total revenue
- Result (Win, Loss, or Inconclusive)
- Primary goal uplift
- Revenue uplift
- AI insights
Experiment results
Kameleoon assigns each experiment one of three result statuses based on statistical reliability:- Win: The variation outperformed the control and reached the reliability threshold.
- Loss: The variation underperformed the control and reached the reliability threshold.
- Inconclusive: The results did not reach the required reliability threshold. The experiment did not generate enough statistical evidence to confirm whether the variation had a positive or negative impact.
Takeaways does not display Primary goal uplift or Revenue uplift for Inconclusive experiments. If revenue tracking is enabled, Takeaways still shows Total revenue.
AI insights
Each experiment card includes insights generated by PBX Analyze, Kameleoon’s AI engine. These insights highlight changes in key metrics such as conversion rate, revenue, and quantity, indicate statistical reliability where relevant, and surface notable trends or unexpected outcomes.Add an image to a card
You can add a custom image to any experiment card to make it easier to identify at a glance.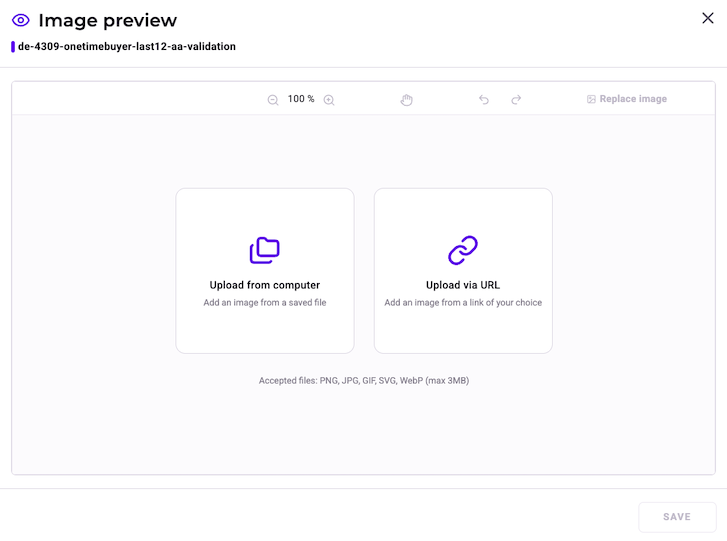
- Click the image area on the left side of the experiment card. The Image preview opens.
- Click Upload from computer to select a file from your device, or Upload via URL to enter an image URL.
- Optionally, use the Resize, Crop, or Flip tools to adjust the image.
- Click Save.
Card actions
Click the three-dots menu on an experiment card to:- Results: Open the experiment’s Results page.
- Add to favorites: Mark the experiment as a favorite.
Experiment details
Click an experiment card to open a detailed view. Detailed results for the experiment appear beneath Insights.
Campaign overview
Click Campaign Overview to expand a section with additional experiment metadata:- Duration
- Target
- Primary goal
- Result
- Primary goal uplift
- Status
- Type
- Creator
Navigation
Use the arrow buttons at the top of the detailed view to navigate to the previous or next experiment.Detailed view actions
In the detailed view, you can:- Click Open the Results page to navigate to the experiment’s full Results page.
- Click the three-dots menu > Results to open the Results page.
- Click the three-dots menu > Add to favorites to mark the experiment as a favorite.
Comments
Use the Comments section to collaborate with your team on experiment results. To add a comment:- Click Add to open the comment text field.
- Enter your comment. Use @ to mention a teammate.
- Click Save to post the comment.