

About the Bayesian method
Unlike the Frequentist approach, which treats the parameters you want to estimate as unknown constants, the Bayesian approach models each parameter as a random variable. The method takes its name from Bayes’ rule, which lets you compute quantities that the Frequentist framework can’t provide. Bayes’ rule combines your experiment results with any available prior information. However, Kameleoon’s A/B testing uses non-informative priors by default. Choosing the a priori distribution lets you use the resulting posterior distribution to compute values, such as the probability that a variation improves upon the original.Enable the Bayesian method
When you click Results on the dashboard, Kameleoon displays the classic Results page by default. To enable the Bayesian statistical method on an experiment:- Open the experiment and click the Data tab in the sidebar.
- Under Statistical methods, click Bayesian.
- Click Apply.
You can’t access the Bayesian Results page if you divert 100% of traffic to the original or if the experiment has zero visitors.
The Bayesian Results page
The Bayesian reporting page follows the same structure as the classic Results page, but some elements differ:- New indicators appear, such as the probability of beating the original variation and result reliability according to Bayes.
- Several graphs don’t appear on the page, and the page displays only the conversion rate.
Definitions
Probability to beat the original
This value represents the probability that a variation outperforms the original page with a higher conversion rate for a given goal. If you allocate 0% of traffic to the original, the variations receive 100% of the traffic and don’t compete with the original. In this case, the indicator becomes the Probability of being the winning variation.Bayesian continuous metrics
When you hover over non-binomial metrics, such as Revenue per visit/visitor or Average cart value, an overlay appears.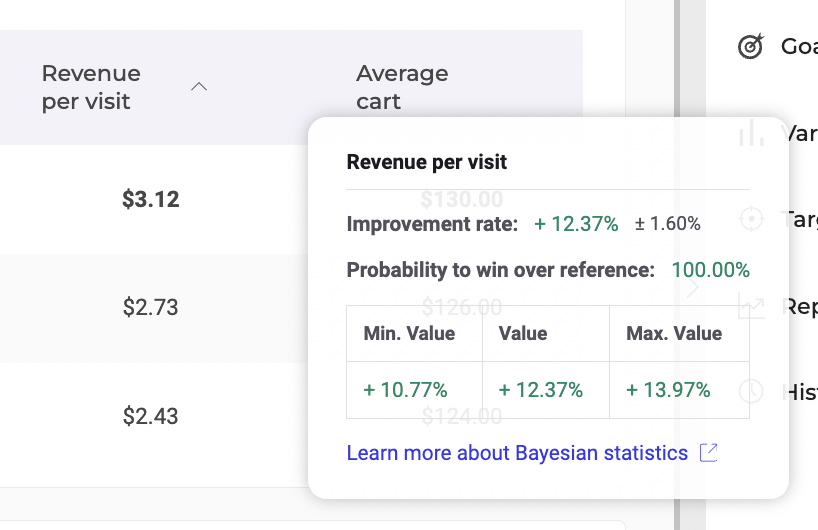
- Improvement rate: This value indicates the rate of improvement for the metric. It appears in green if positive and red if negative, alongside a credible interval.
- Probability to win over reference: This value shows the probability that the variation outperforms the control variation. It appears in green if it’s higher than the reliability threshold set in the configuration; otherwise, it appears in red.
- Credible interval table: The min and max values define the bounds of the credible interval around the improvement rate. The improvement rate has a 95% chance of falling between these values. The values appear in green if positive and red if negative.