

What’s Winsorization?
Winsorization is a statistical technique that limits extreme values in your data, using percentiles to reduce the impact of outliers. Outliers are data points that differ significantly from other observations, and they can skew the results of your A/B tests. Winsorizing your data makes your results more robust and reliable.Why Winsorization matters in A/B testing
In A/B testing, you compare two or more variations to determine which one performs better. Outliers can distort the true performance of these variations and lead to misleading conclusions. Applying Winsorization mitigates the effect of these extreme values and gives you more accurate, actionable insights. Winsorization is particularly useful when:- Your data contains extreme values that aren’t errors but are still significantly different from other observations.
- You want a simple and effective method to handle outliers without resorting to more complex techniques.
- You need to balance data integrity against managing outliers effectively.
Risks and good practices with Winsorization
Winsorization is a valuable tool, but it carries risks:- Loss of data integrity: Excessive Winsorization can significantly alter your data, potentially masking important variations and patterns.
- Over-simplification: Modifying outliers can oversimplify your data, which can result in an incomplete understanding of your dataset.
- Bias introduction: Inappropriate Winsorization thresholds can introduce bias, skewing your results and leading to incorrect conclusions. If you don’t ensure symmetry around the mean, such as using the fifth and ninety-fifth percentile, you might alter the mean.
- Understand your data: Before applying Winsorization, thoroughly understand the nature and distribution of your data. Understanding your data helps you set appropriate thresholds for identifying outliers.
- Set appropriate thresholds: Use industry standards or data-specific insights to set your Winsorization thresholds. Common thresholds cap the top and bottom 0.1% up to 5% of your data, but adjust these based on your specific use case.
- Evaluate impact: After applying Winsorization, evaluate its impact on your data and test results. Compare the Winsorized data with the original to ensure you don’t lose important information.
- Document your process: Keep a detailed record of your Winsorization process, including the rationale for your chosen thresholds and their impact on your data. This transparency aids in reproducibility and understanding.
How to implement Winsorization in Kameleoon
1. Create a custom goal
Create a custom goal to apply Winsorization to.2. Set limits
Set limits to replace the outliers. For example, if you use 95% Winsorization, Kameleoon sets any data point below the 2.5 percentile to the value at the 2.5 percentile, and any data point above the 97.5 percentile to the value at the 97.5 percentile. Find these bounds in the Advanced settings of your custom goal. If your custom goal includes a Revenue metric, Kameleoon applies Winsorization to it. Kameleoon computes these percentiles across all account data for the goal, not per experiment. For details, see Scope of thresholds (the preceding section).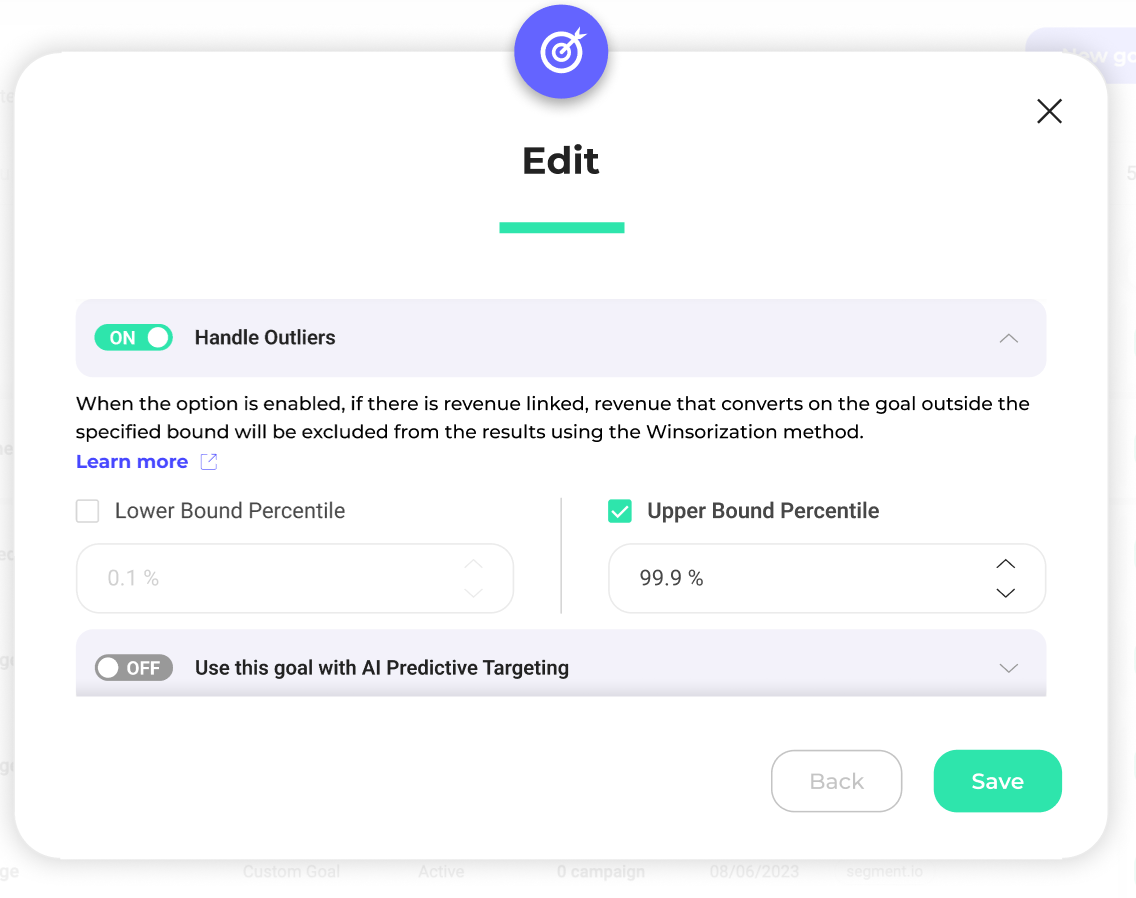
3. Read your results
After you apply Winsorization to your goal, you can read the adjusted results on any Results page that includes that goal. The goal container then displays a badge indicating that Kameleoon handles outliers for that goal. Hover over the badge to view the parameters you set.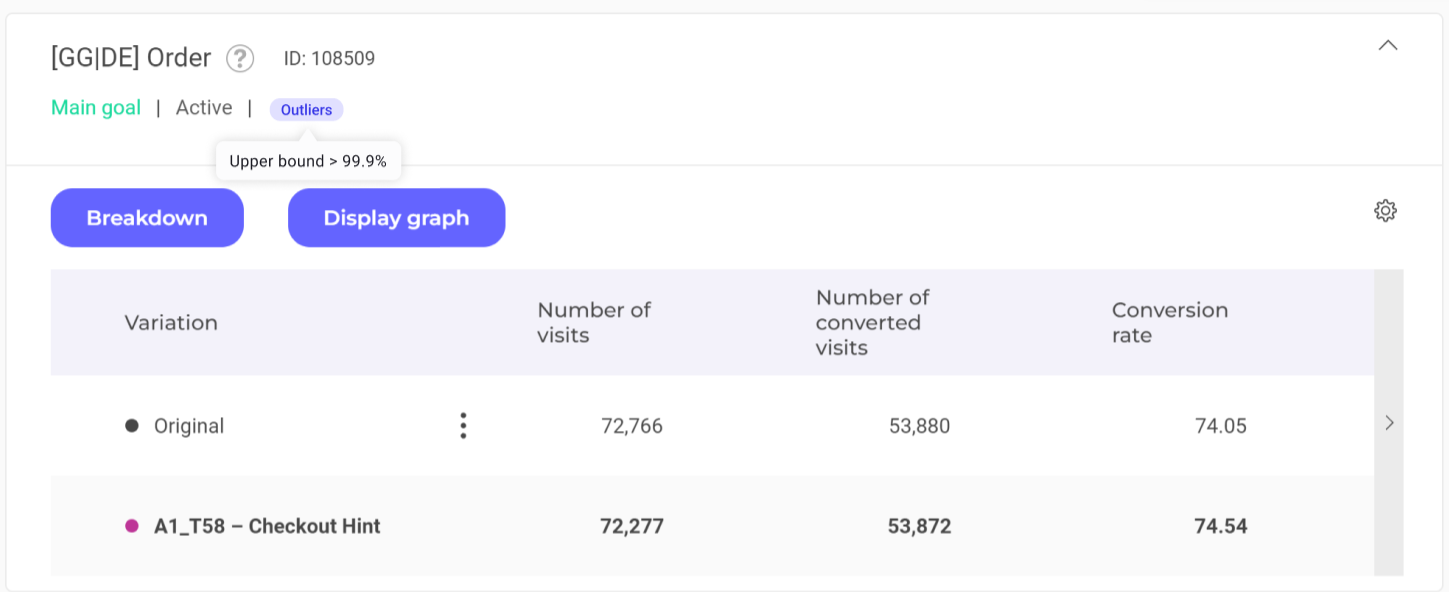
Example of impact
Consider an A/B test comparing two landing pages, A, and B. Without Winsorization, a few high-value outliers, such as purchases made by a few very high-spending users, could make one page appear significantly more effective, even if typical user behavior doesn’t support that conclusion.- Original data (metric: Revenue per user):
- Page A:
[10, 12, 14, 15, 16, 18, 100] - Page B:
[11, 13, 15, 15, 17, 19, 110]
- Page A:
- Winsorized data:
- Page A:
[10, 12, 14, 15, 16, 18, 18] - Page B:
[11, 13, 15, 15, 17, 19, 19]
- Page A: